
Abigail Tierney
Research expert covering U.S. politics and economics

Detailed statistics
U.S. annual GDP 1990-2024

Detailed statistics
U.S. real GDP growth rate 1990-2023
Detailed statistics
Gross domestic product (GDP) per capita in the United States 2029
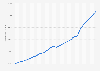
U.S. annual GDP 1990-2024
Gross domestic product of the United States from 1990 to 2024 (in billion current U.S. dollars )
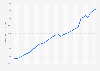
U.S. chained real GDP 1990-2023
Real gross domestic product of the United States from 1990 to 2023 (in billion chained 2012 U.S. dollars)
U.S. real GDP growth rate 1990-2023
Annual growth of the real gross domestic product of the United States from 1990 to 2023

U.S. real GDP Q2 2013- Q2 2024
Quarterly real gross domestic product of the United States from the second quarter of 2013 to the second quarter of 2024 (in trillion chained 2017 U.S. dollars)

U.S. real GDP growth by quarter Q2 2013- Q2 2024
Annualized growth of real GDP in the United States from the third quarter of 2013 to the third quarter of 2024

U.S. per capita real GDP 2023
Per capita real gross domestic product of the United States from 1990 to 2023 (in chained 2017 U.S. dollars)

U.S. GDP forecast 2024-2034
Forecast of the gross domestic product of the United States from fiscal year 2024 to fiscal year 2034 (in billion U.S. dollars)

U.S. real value added to GDP 1990-2023, by sector
Real gross value added to the gross domestic product of the United States from 1990 to 2023, by sector (in billion chained 2017 U.S. dollars)

U.S. value added to GDP 2024, by industry
Value added to the gross domestic product of the United States in 2024, by industry (in billion U.S. dollars)

U.S. gross domestic product contributions 2000-2021, by sector
Value added to gross domestic product across economic sectors in the United States from 2000 to 2021 (as a share of GDP)

U.S. value added to GDP by manufacturing industry 2000-2023
Value added to the gross domestic product by the manufacturing industry in the United States from 2000 to 2023 (in trillion U.S. dollars)

Tech GDP as a percent of total GDP in the U.S. 2017-2023
Tech sector as a percentage of total gross domestic product (GDP) in the United States from 2017 to 2023

U.S. digital economy value added to GDP 2022, by industry
Value added to the total economy (GDP) by the digital economy in the United States in 2022, by industry (in million U.S. dollars)

U.S. value added to GDP by services sector 2023, by industry
Service sector value added to the gross domestic product of the United States in 2023, by industry (in billion U.S. dollars)

U.S. value added to GDP by construction industry 2000-2023
Value added to gross domestic product by the construction industry in the United States from 2000 to 2023 (in billion U.S. dollars)

U.S. gross domestic product 2023, by state
Gross domestic product of the United States in 2023, by state (in billion current U.S. dollars)

U.S. real gross domestic product 2023, by state
Real gross domestic product (GDP) of the United States in 2023, by state (in billion chained 2017 U.S. dollars)

U.S. real GDP growth 2023, by state
Percent change in the real gross domestic product of the United States in 2023, by state

U.S. real GDP of California 2000-2023
Real gross domestic product of California in the United States from 2000 to 2023 (in billion U.S. dollars)

U.S. real GDP of Texas 2000-2023
Real gross domestic product of Texas from 2000 to 2023 (in billion U.S. dollars)

U.S. real GDP of New York 2000-2023
Real gross domestic product of New York in the United States from 2000 to 2023 (in billion U.S. dollars)

U.S. real GDP of Florida 2000-2023
Real gross domestic product of Florida in the United States from 2000 to 2023 (in billion U.S. dollars)

U.S. real GDP 2023, by metro area
Real gross domestic product of the United States in 2023, by metropolitan area (in million chained 2017 U.S. dollars)

U.S. New York metro area GDP 2001-2023
GDP of the New York metro area in the United States from 2001 to 2023 (in billion chained 2017 U.S. dollars)

U.S. Los Angeles metro area GDP 2001-2023
GDP of the Los Angeles metro area in the United States from 2001 to 2023 (in billion chained 2017 U.S. dollars)

U.S. Chicago metro area GDP 2001-2023
GDP of the Chicago metro area in the United States from 2001 to 2023 (in billion chained 2017 U.S. dollars)

U.S. San Francisco Bay Area GDP 2001-2023
GDP of the San Francisco Bay Area in the United States from 2001 to 2023 (in billion chained 2017 U.S. dollars)

U.S. Dallas-Fort Worth metro area GDP 2001-2023
GDP of the Dallas-Fort Worth metropolitan area in the United States from 2001 to 2023 (in billion chained 2017 U.S. dollars)

United States share of global gross domestic product (GDP) 2029
United States' share of global gross domestic product (GDP) adjusted for purchasing power parity (PPP) from 2019 to 2029

Countries with the largest gross domestic product (GDP) 2024
The 20 countries with the largest gross domestic product (GDP) in 2024 (in billion U.S. dollars)

Countries with the largest gross domestic product (GDP) per capita 2025
The 20 countries with the largest gross domestic product (GDP) per capita in 2025 (in U.S. dollars)

GDP growth in the leading industrial and emerging countries 2nd quarter 2023
Growth of the real gross domestic product (GDP) in the leading industrial and emerging countries from 2nd quarter 2021 to 2nd quarter 2023 (compared to the previous quarter)


Mon - Fri, 9am - 6pm (EST)
Mon - Fri, 9am - 5pm (SGT)
Mon - Fri, 10:00am - 6:00pm (JST)
Mon - Fri, 9:30am - 5pm (GMT)
Mon - Fri, 9am - 6pm (EST)


